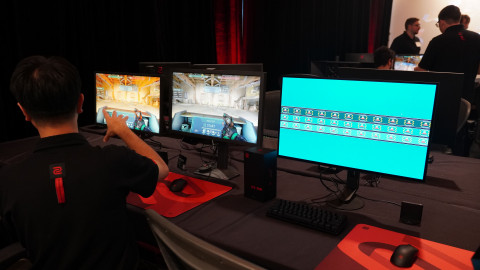
On the 6th, Nexon introduced its game operations data analysis service, 'Nexon Stats,' via the Nexon Tag platform.
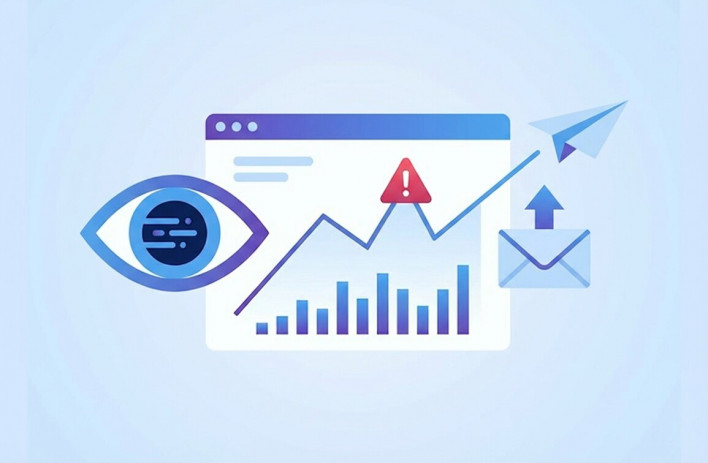
During game service operations, there are moments when abnormal signs appear, such as a sudden dip in a metric graph. Previously, the clues needed to identify the cause were scattered across various locations—KPI dashboards, official website notices, and community forums—forcing staff to toggle between multiple windows to find answers. This meant that a significant amount of time was spent just identifying the cause before any problem-solving could even begin.
'Nexon Stats' is a service that connects all issues and metrics occurring during operations on a single timeline. By utilizing the internal user trend analysis system 'User Voice,' it collects real-time user reactions from official notices, communities, and social media. It also integrates with external BI tools like Tableau and Power BI to create a unified control hub.
Starting with just one game, Nexon Stats is now used in over 25 projects. Its core functions were designed as common modules, while a structure that reflects game-specific requirements allowed for rapid expansion. Through features like comparison based on the lookup date, it is helping shift operational practices from reactive response to proactive preparation. By designing an experience where comparisons happen naturally, Nexon Stats helps operators avoid the constant dilemma of 'what should I compare this to?' and supports overall operations.
Nexon Stats: What You See When You Connect Data NEXON BLOGThere is an inevitable moment in game operations: when a smooth metric graph suddenly dips, signaling an anomaly. While there are countless potential causes, the clues are scattered everywhere—from KPI dashboards and official website notices to community forums. Operators used to have to keep multiple windows open on their monitors to piece together the clues. They spent a significant amount of time just finding the cause before they could even start solving the problem.
But that is no longer necessary. We now have a service called 'Nexon Stats' that connects all issues and metrics occurring during operations on a single axis.
Bringing Scattered Metrics and Issues Together
The Nexon Stats service began with a request from an internal team. At the time, that team was already using its own custom-built metrics tool. The problem was that metrics and issues existed separately. While issues like updates, events, and maintenance constantly occur during game service, there was no tool to check "what happened at that moment" on the same screen when metrics fluctuated.
In particular, to determine if a current issue had occurred in the past, staff had to manually cross-reference update pages and notices one by one or search for keywords to reconstruct the situation. Even for staff who knew the game inside and out, it was not easy to remember events from six months or a year ago.
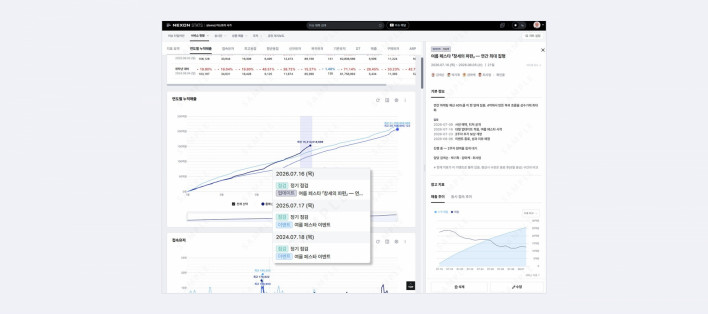
The solution proposed by the Nexon Stats development team was to overlay events onto the numbers according to a schema. By layering the context of 'issues' over the metrics that detect anomalies, the numbers stopped being just simple changes and began to be read as a story. Analysis that once relied on the operator's memory shifted to a method of reading data and context together.
Once the vessel for the data was created, the next challenge followed: defining the boundaries of an 'issue.' Since problems during CS responses, routine maintenance, or even a single video from a creator could all be considered issues, we had to establish criteria for what information was reliable enough to include. After much discussion, the Nexon Stats team decided to define issues broadly as 'any event that could affect game metrics.'
With the scope of issues defined, we had to decide where and how densely to collect them. Fortunately, Nexon already had 'User Voice,' an internally developed user trend analysis system. It collected real-time user reactions not only from official website notices but also from various communities and social media. By processing this data for our purposes, the Nexon Stats team was able to streamline the process significantly.
Furthermore, the Nexon Stats team integrated external BI tools already in use by various departments, such as Tableau and Power BI, allowing all necessary operational information to be viewed in one place. This created a control hub where operators can discover anomalies, track causes, and perform necessary analyses in a one-stop, seamless environment without switching between systems.
One Experience Becomes Another Starting Line
Can a method verified for one game work for others? Nexon Stats, which started with one game, gradually expanded its scope. The work processes and operational know-how accumulated from one project could be quickly applied to new ones. Currently, Nexon Stats is used in over 25 projects. The experience from one game has effectively advanced the starting line for the next.
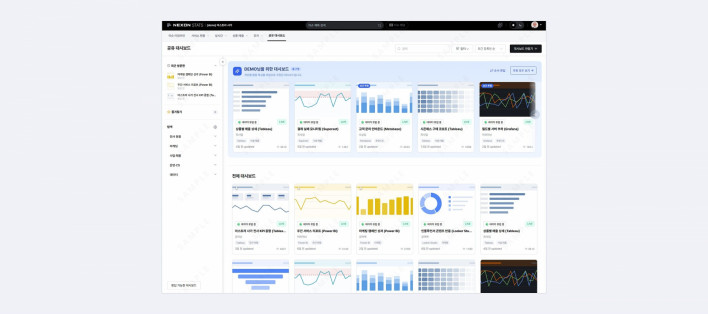
The background to this rapid expansion was a development structure designed for reuse. Core functions like the issue timeline and shared dashboards were designed as modules applicable to all games, with game-specific features added on top. It is like replacing only the necessary blocks in a finished Lego set; there is no need to develop from scratch when a new game is added.
Of course, a method verified for one game did not always work perfectly for another. Each game has different service methods, operational environments, and unique issues and metrics to monitor. Therefore, the Nexon Stats team worked closely with each department to add necessary metrics, decide which issues to display, and even fine-tune details like checkboxes to match actual operational styles. While the screens may look similar on the surface, they contain countless considerations and development efforts reflecting the unique requirements of each game.
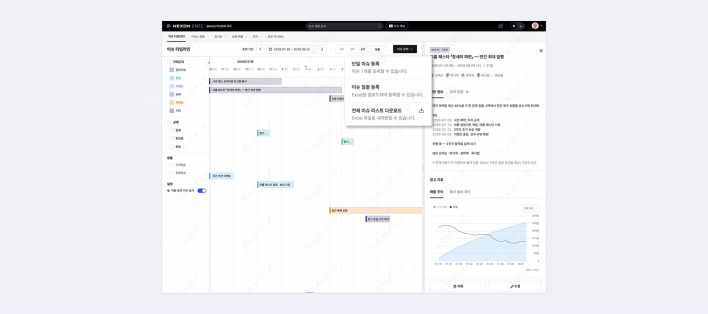
As this experience accumulated, the Nexon Stats team established criteria for what should be a common function and what should be implemented according to game-specific characteristics. Lessons learned from each project naturally flowed into the design and operation of the next, creating a virtuous cycle where one experience becomes the starting line for another project.
From Reactive to Proactive, and Beyond
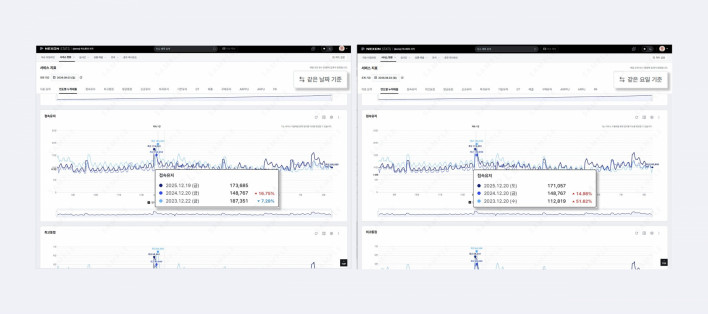
In live game operations, the significance of performance metrics changes completely depending on 'what you compare them to,' rather than the absolute numbers. Because games have recurring seasonality, events, and update cycles, comparing to the 'past under the same conditions' is the fairest benchmark. Therefore, the Nexon Stats team's goal was to set the right comparison points so that operators could interpret metrics correctly.
Features were created to compare yesterday, last week, last month, last year, and the year before based on the lookup date; to compare the same days of the week to remove day-of-the-week effects; and to examine metrics by dividing periods based on update timing. Ultimately, Nexon Stats was designed to ensure that comparisons happen naturally, so operators don't have to worry about 'what to compare' every time.
As data accumulates, past issues no longer remain just records of the past. By connecting issues that occurred at similar times with their causes, we can discover recurring patterns and long-term trends. This not only provides a basis for responding faster and more accurately when the same problem recurs, but also serves as an important benchmark for identifying recurring risks in advance and preparing future operational strategies. It is expanding from data that looks back at the past to data that prepares for the future.

The data was always there; it was just scattered. What Nexon Stats did was connect that scattered data and make it usable across boundaries. And the ultimate destination of that entire process is the user. If you suddenly feel a better experience while playing a game, it might be because someone spent their time listening to every small signal sent by the users.

Sort by:
Comments :0